Business decisions made on T+7 data in a T+0 market are made in the dark. Real-time business intelligence dashboards are hence not a luxury for data-mature businesses; they are table stakes for operational decision-making.
When every dashboard request goes into an analyst's backlog, business teams either wait or guess. Analytics dashboard software built on a governed semantic layer lets teams answer their own questions without compromising data consistency.
When revenue is calculated differently in the finance dashboard, the sales tool, and the marketing report, every cross-functional meeting starts with a 20-minute debate about whose numbers are right. Standardized metric definitions in a semantic layer end that debate once and for all.
Dashboards that require SQL for every change limit data usage to a tiny handful of specialists. To turn analytics into a company-wide power, businesses need self-service analytics tools featuring governed metrics, simple filters, and ready-to-use templates that anyone can navigate.
From Raw Data to Real-Time Business Decision
Empower your teams to move from raw data to real-time business decisions with an all-in-one data dashboard platform that automates KPI governance and refreshes dashboards in real-time.
From warehouse to decision — sub-second query, real-time refresh
Warehouse · APIs · Events · DB
Metrics · Dimensions · KPIs
Sub-second SQL + cache
Real-time charts + alerts
Self-serve decisions
Five layers from data to decision
Sub-second query performance on your existing data warehouse with no data duplication.
Single source of truth for KPI definitions, preventing the "whose numbers are right" problem.
Business-friendly interface with governed dimensions, filters, and pre-built templates requiring no SQL.
Scheduled report delivery via email and Slack with anomaly detection and threshold alerting.
Conversion funnel visualization and customer cohort retention analysis built as standard views.
Data access controlled by team, region, or product, so every user sees only what they should.
Dashboard components embeddable in your SaaS product for customer-facing analytics features.
Trend-based forecasting overlaid on key metrics with confidence intervals and seasonality adjustment.
Full dashboard functionality on mobile for executives and field teams.
The team reviews all current reports and agrees on clear definitions for every business goal (KPIs). They map the data sources and design the technical architecture. Finally, leadership approves which dashboards are most important.
Engineers build the source of truth by setting up official definitions for all metrics. They connect the data warehouse and set up security so people only see the data they are allowed to see. They also fine-tune the system so it runs fast.
The team builds the main dashboards for each department. They create easy-to-use templates so employees can find their own answers. They also set up automated reports and alerts and ensure everything looks good on mobile devices.
The platform opens to the entire company. The team provides hands-on training and clear guides on how to use and expand the dashboards. For the first 30 days, experts are available to provide extra support and fix any issues.
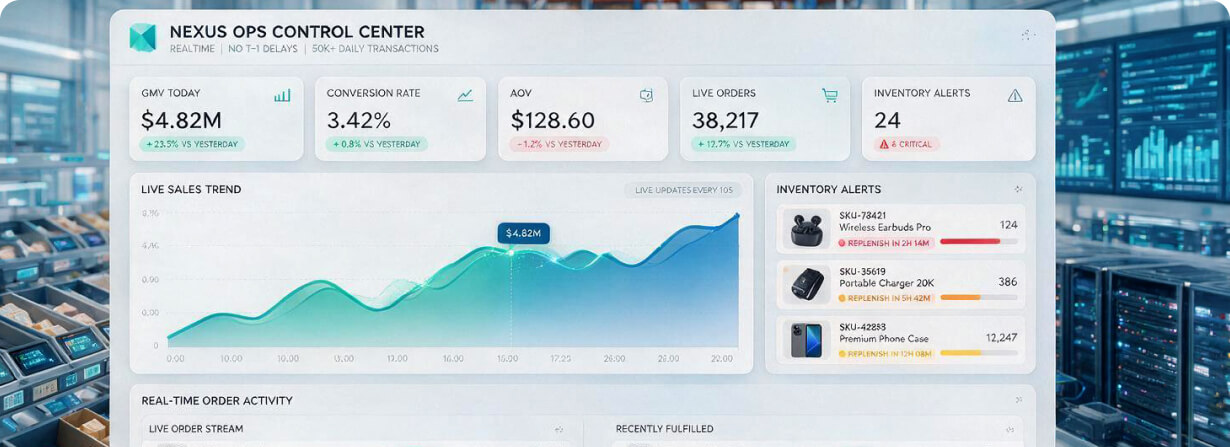
Real-time operations dashboard replacing T+1 daily reports — live GMV, conversion rate, AOV, and inventory alerts for a retailer processing 50,000+ daily transactions.
Outcome:
Decision response time to conversion rate drops reduced from 24 hours to 4 minutes; revenue protected from undetected checkout issues estimated at £180K in the first quarter.
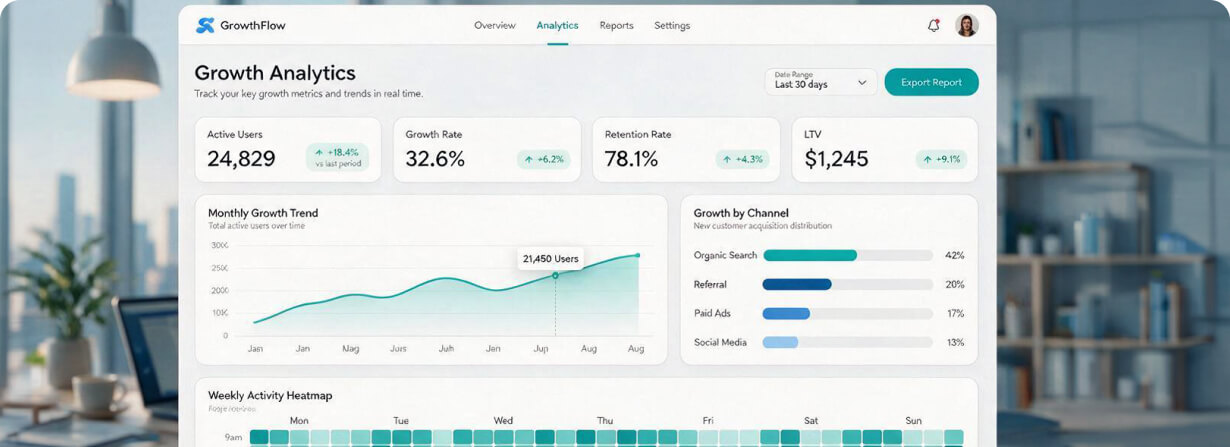
Self-serve product analytics platform for a B2B SaaS company — MRR, churn, expansion revenue, activation funnel, and feature adoption metrics unified across billing, product, and CRM data.
Outcome:
Analyst time on routine reporting requests reduced by 70%; product team decision cycle from data request to action reduced from 5 days to the same day.

Automated regulatory and executive reporting platform replacing manual Excel-based reports — connecting trading, risk, compliance, and operations data into a governed metrics layer.
Outcome:
Monthly close reporting time reduced from 8 days to 6 hours; regulatory reporting error rate reduced to zero; CFO real-time P&L visibility enabled for the first time.
Standard business intelligence dashboard tools are many, but they require SQL knowledge that most business users don't have, data preparation that creates analyst backlogs, and metric definitions that diverge across teams over time. Our data dashboard platform adds a governed semantic layer on top of your existing warehouse, so business teams can answer their own questions through an intuitive interface without writing a single line of SQL. Every metric is calculated consistently regardless of who's looking at it or which report they're using.
It means revenue carries the same data and meaning, regardless of which team's dashboard you're looking at. The semantic layer is a centralized definitions engine that sits between your raw data warehouse and every analytics dashboard software interface. Finance, marketing, and product all query the same underlying metric logic.
The real-time analytics platform natively connects to major data warehouses such as Snowflake, BigQuery, Redshift, Databricks, and PostgreSQL. We do not move or duplicate your data. Queries run directly against your warehouse with a Redis caching layer for sub-second response on common queries and materialized views for the heaviest aggregations. Your data stays where it is; the real-time analytics platform adds the query optimization, metric governance, and visualization layer on top of it.
Yes, and this is the core design intent. The self-serve analytics interface uses natural language filters, pre-built KPI templates, drill-down exploration, and role-based dashboard access so that a commercial director, a category manager, or a finance partner can answer their own questions without opening a ticket. We build the initial dashboard set and metric library during the engagement, then train your team to create and modify their own views going forward. Analyst time shifts from producing reports to higher-value modeling and analysis work.
Most clients have a production KPI dashboard software environment with their core metrics live in a few weeks. The first few days cover warehouse connection, semantic layer design, and metric definition. This is where we align with finance, commercial, and product on what "good" looks like for each number. The next few days and weeks are for the data dashboard platform build and iteration. Teams that come in with clear metric requirements and good warehouse documentation move faster; those still resolving metric disagreements take longer.


Since 1999, SunTec has been a trusted business process and software engineering partner for technology companies worldwide. Our team of over 1,500 full-time employees delivers innovative services every day to help our clients save time and money.


