Free Consultation. Guaranteed Response within 8 Business Hours.
Our client is a leading market research firm specializing in consumer sentiment analysis. They conduct large-scale surveys across diverse sectors, collecting open-ended responses from thousands of participants each week. While their in-house automation tool helps collect data, the survey response mapping process remains heavily manual, requiring time-intensive data extraction, cleaning, and tagging.
They were performing manual classification of qualitative survey responses and storing the data in Excel, leading to the following issues:
The client needed a solution that could automate survey data review and classification, and share the results with the relevant stakeholders. They wanted to process 800+ unformatted and heterogeneous survey responses weekly with speed and precision.
Our AI engineers had to work through the following challenges:
We developed an AI-powered solution that automates survey response classification, reduces manual effort, and ensures high accuracy.
Here is what we did:
We spent about 2 weeks reviewing and ingesting all survey responses (to date) from the client’s database and transformed them into a structured format, ready for classification. This included cleaning the raw data and standardizing formats for processing. Our AI experts then annotated their data using accurate labels.
Using the client’s labeled data, we trained an NLP and a classification model to understand various response patterns and classify them into over 24 categories. Based on the responses, we fine-tuned the model to handle variations in tone, context, and language.
We set up additional rules for mapping each response category to relevant stakeholders (e.g., product managers, market researchers). This was done over a period of 2-3 weeks of testing.
We integrated the classified responses back into the client’s reporting system, ensuring seamless flow to their final output format.
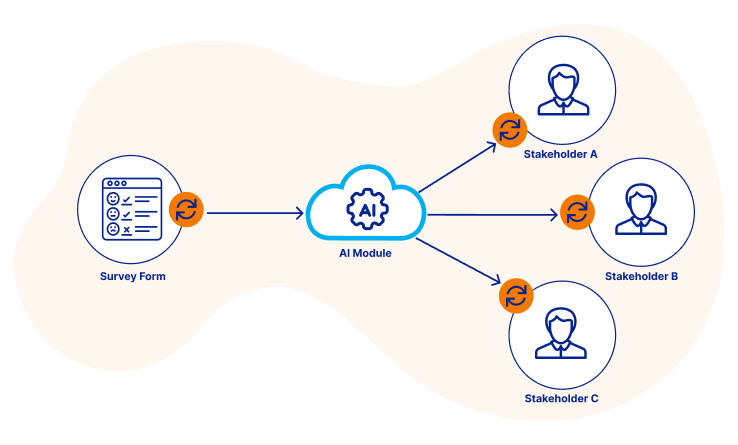
Raw survey responses are provided in Excel format for processing.
The AI model analyzes and classifies responses based on predefined topics.
Labeled data mapped to relevant stakeholders for actionable insights.
Easily integrates with the client's existing survey platform and workflows for smooth operations.
The AI model is designed to classify survey responses across 24+ diverse topics, organized into key categories for comprehensive analysis:

01 - A cleaner interface and not unnecessary info.
02 - A clear indication of the restocking fee.
Our AI-powered response mapping and classification solution delivered the improvements:
60% reduction in time spent on data tagging
98% accuracy in survey response classification
Successfully processed 800+ survey responses weekly.
45% decrease in operational costs
Since 1999, SunTec has been a trusted business process and software engineering partner for technology companies worldwide. Our team of over 1,500 full-time employees delivers innovative services every day to help our clients save time and money.